Overview
The integration of EnforceDNS with Microsoft Sentinel offers a powerful enhancement to your security operations by seamlessly delivering EnforceDNS logs into the Sentinel SIEM environment. This setup lets you leverage Sentinel’s capabilities for advanced security insights, threat detection, and incident response with the enriched visibility that EnforceDNS provides on your DNS traffic.
By routing your EnforceDNS logs directly into Sentinel, you can access, analyze, and correlate data within your centralized Sentinel workspace. This enables SOC analysts and security teams to:
-
Enhanced Threat Detection and Correlation: EnforceDNS’s DNS-layer data, fed into Sentinel, allows you to see malicious traffic patterns and DNS-based threats as they emerge, which enhances Sentinel’s AI-driven detection capabilities. You’ll be able to use Sentinel’s native correlation with other logs (network, endpoint, identity, etc.) to uncover threats that span different attack surfaces.
-
Advanced Threat Hunting: With EnforceDNS logs in Sentinel, you can use custom KQL (Kusto Query Language) searches to perform deeper, more granular analysis of DNS traffic patterns. This visibility helps uncover stealthy activities such as data exfiltration or C2 communications that would otherwise go undetected in a single-solution environment.
-
Automated Incident Response: Sentinel’s built-in SOAR (Security Orchestration, Automation, and Response) capabilities can use EnforceDNS logs to trigger automated responses. For example, Sentinel can quarantine affected devices, block IP addresses, or initiate alerts to key personnel when a DNS-based threat is detected, enabling faster containment.
-
Customized Dashboards and Reporting: Sentinel’s flexibility allows you to build dashboards and reports that visualize EnforceDNS data in ways tailored to your organization’s needs. By doing so, you can showcase critical DNS security metrics, track performance, and report on trends in real time, ultimately improving visibility and communication with stakeholders.
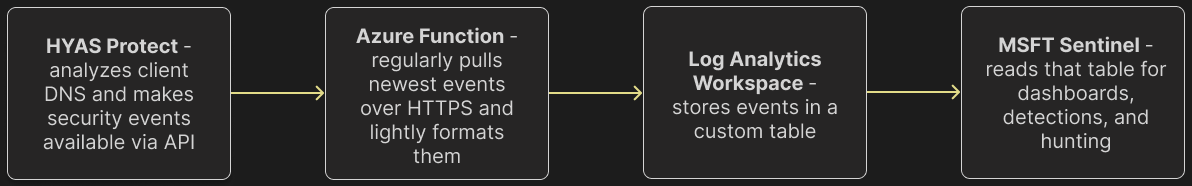
EnforceDNS ↔ Microsoft Sentinel High-Level Integration Architecture
Getting Started
Follow the steps below to deploy the EnforceDNS Integration with Microsoft Sentinel
Application Installation
-
Login to the Microsoft Azure Platform.
-
Navigate to Microsoft Sentinel.
-
Select your Workspace.
-
Go to "Content Hub" under "Content Management".
-
Search for "EnforceDNS" and click "Install".

Application Configuration
-
Once installed, click on the “Manage” option.
-
Select “EnforceDNS (using Azure Functions)” and click on “Open Connector Page” as shown below.
-
-
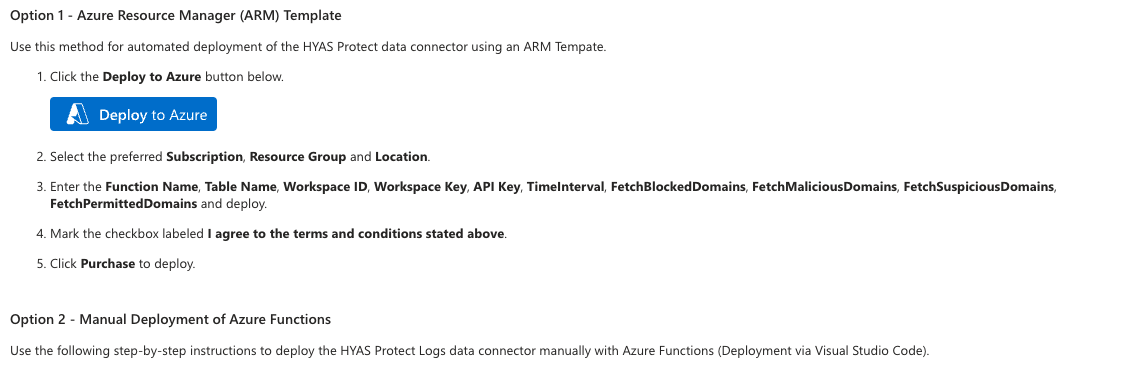
Next, click on, “Deploy To Azure” button as shown below.
-
-
On the configuration setup page, enter the following values:
-
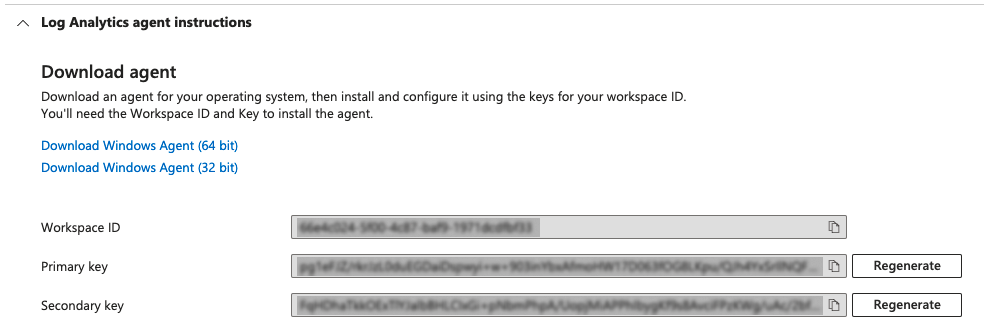
Workspace ID
-
Obtaining from Workspace ID: Navigate to Microsoft Sentinel and select your Workspace then: Settings>Workspace settings>Settings>Agents>Log Analytics agent instructions
-
-
-
Workspace Key
-
See last step to acquire the Workspace Key.
-
-
EnforceDNS API Key
-
This value was given to you at initial set up of your account. If you need a new one, please reach out to your administrator and they can reset your API via the Manage User Accounts feature.
-
-
App Insights Workspace Resource ID (FQDN)
-
Obtaining your Workspace Resource ID (FDQN): Navigate to Microsoft Sentinel and select your desired Workspace. Then: Configuration>Settings>Workspace settings>Settings>Properties. Your Resource ID will be stored here and look similar to /subscriptions/{subscriptionId}/resourceGroups/{resourceGroupName}/providers/Microsoft.OperationalInsights/workspaces/{workspaceName}
-
-
-
Click "Review + Create". This will deploy a function that fetches logs from EnforceDNS and saves them into the Microsoft Sentinel platform.
-


Log Viewing, Analysis
-
Navigate to Microsoft Sentinel.
-
Select your workspace and click "Logs" under "General".
-
This will open a table where you can find the logs under "Custom Logs" with the table name provided during the configuration setup (e.g., "HYASProtectDnsSecurityLogs").
It may take a few minutes to begin see logs and for the data connecter to show as connected.
